TABLE BELOW LONGITUDINAL SECTION
Settings > Drawing > Table
Menu: Tools > Settings > Drawing > Table
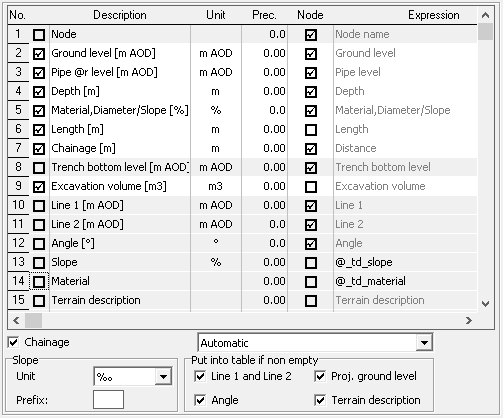 The user can modify the contents of the table inserted under the logintudinal cross-section drawing. List of data that can be placed in the table is stored in the other table in the Settings window - menu: Tools > Settings > Drawing > Table. The table contains the following columns:
- No. - item number determines the order of the data. The order can be changed by clicking (on a column No.) and dragging the row in another location,
- Checkbox row - only the selected rows in the second column are placed in the table below the profile,
- Description - The title line that appears at the beginning of the table. In the pipe level row, is possible to use a variable @r, which at the time of generating the drawing will be replaced by the word "axis", "bottom" or "top" - depending on the profile settings. In rows applicable to flow is possible to use the @flow_unit variable, which will be converted to the currently selected Flow unit.
- Unit - A unit in which values are presented in a row,
- Precision - The precision with which it is presented by a number (number of decimal places),
- Node - a checkbox to be selected if the data presented is related to a node and not to the section between the nodes. From the appropriate selection depends, among others direction of the text in the row (vertical or horizontal),
Example with the aforementioned option disabled (left) and with it enabled:
- Expression - Expression can only change in rows added by the user. A formula can consist of variables and values. For example, using the expression "@_td_ground_level+1" will result in the elevation of terrain value from Data table increased by 1. After adding a line based on this formula, you can get a line parallel to the line of site.
- Height - is determined as a percentage of the default row height of the table.
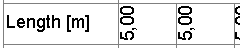
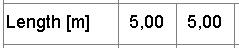
- Connect - when this option is checked, if the same value occurs in neighboring nodes, the description will appear only once. This option works only with section data (e.g., slope, material, scale), that is, the option in the Node column cannot be checked.
Example with the aforementioned option enabled...

... and with the disabled:

Example: Adding the row "Underground warning tape" to the table under the longitudinal cross-section.
Assumption: the tape is to be laid 30 cm above the top of the pipeline.
First, add a new row to the end of the table by pressing the cursor down on the keyboard (while on the lowest row of the table) or by right-clicking on the table and selecting Add.
Then, in the newly inserted row, fill data in columns: the first one after No. we mark to make the row appear under the profile. In the next ones we specify: the title - Warning tape, the unit - m AOD, the required rounding level. In the Node column, check the existing option, because the ordinates of the tape are to appear at the nodal points.
The most important column in this example is the Expression. In it, you should use the available variables so as to obtain an action that will result in the ordinate of the tape. According to the previous assumption, the ordinate of the tape at a given node should be 30 cm higher than the ordinate of the top of the pipe. So, the action will take the form [ordinate of the bottom of the pipe]+[diameter of the pipe]+0.3 m, which with the use of variables will look as follows: @_td_pipe_bottom_level+@_td_diameter_m+0.3. If it would be necessary to place the tape above the pipeline by another value than 30 cm (0.3 m), then you need to change 0.3 to the required value in the formula. The other columns can be left with automatically added default values.

If the "Warning tape" row is also to be used in projects created in the future then click the Save as default button.
If a line is to be drawn on the profile drawing based on the determined ordinates of the tape, it should be added in the Lines section.
By checking the box Chainage to get under the table line with those distances. The listbox Chainage allows you to specify the unit, which will be given full value of the distance. Choosing Automatic causes selection the largest unit for given profile, eg. when the total length is 321.50 m profile unit in which distances will be given hectometres.
If the data group in the table Put into table when non empty will be awarded an option "Line 1" and "Line 2" and/or "Angle" and/or "Terrain description" then will be placed into table under the profile data from the column "Line 1", "Line 2" and "Angle" and "Terrain description" (regardless of the settings in the appropriate positions in the table above), if the above data has been entered.
The Slope > Unit list allows you to choose how the slope value is presented in the table under the profile. Selecting the Inverted option from this list causes the inverse of the slope to be entered in the table (e.g.: 50 for a slope of 2%). This type of notation is used in some countries. The text entered in the text field Slope > Prefix will be placed before the drop value.
For the changes made are saved when you quit, press the button Save.