MARKING PARCELS BOUNDARIES
Boundaries
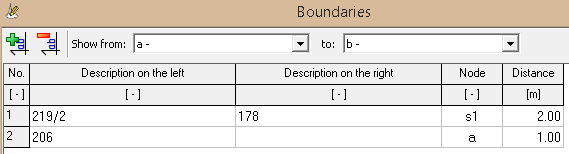
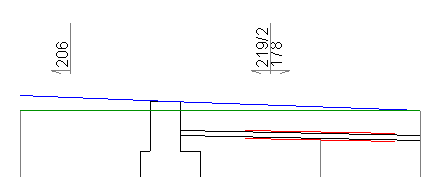
In Boundaries window you can enter parameters of parcel boundaries, which are crossed by designed pipeline on its route. The markings are placed on profile and scheme drawings, above the terrain line (example below). On a schematic drawing land plot boundaries are marked symbolically, always at right angle to a pipeline (which is not necessarily reflected in reality).
Boundaries descriptions should be entered after entering data in the Data table in the main program window. The user can narrow down the number of boundaries presented in the table by selecting nodes between which they are located.
Columns description:- Description on the left - Description of the plot placed on left side of boundary,
- Description on the right - Description of the plot placed on right side of boundary,
- Node - node name (from Data table), which will be given the distance to boundary. When you edit this value you must select a node from a list of existing ones. Boundary is assigned to the selected node, ie, the user can freely change its position in the table each time without the need to update its position.
- Distance - distance from node from Node column to boundary. This value can be negative if it refers to node placed behind boundary.
Sample:
Current version:4.20
- Data table
- Data table - shortcuts
- Entering data
- Data exchange
- Network creating rules
- Searching data
- Profile parameters
- Crossings editor
- Protecting tubes editor
- Cross section editor
- Geological cross section
- Terrain description
- Boundaries description
- Additional ordinates
- Sewage treament plant
- Manholes
- Statistic
- Statistic - algorithms
- Materials' list